
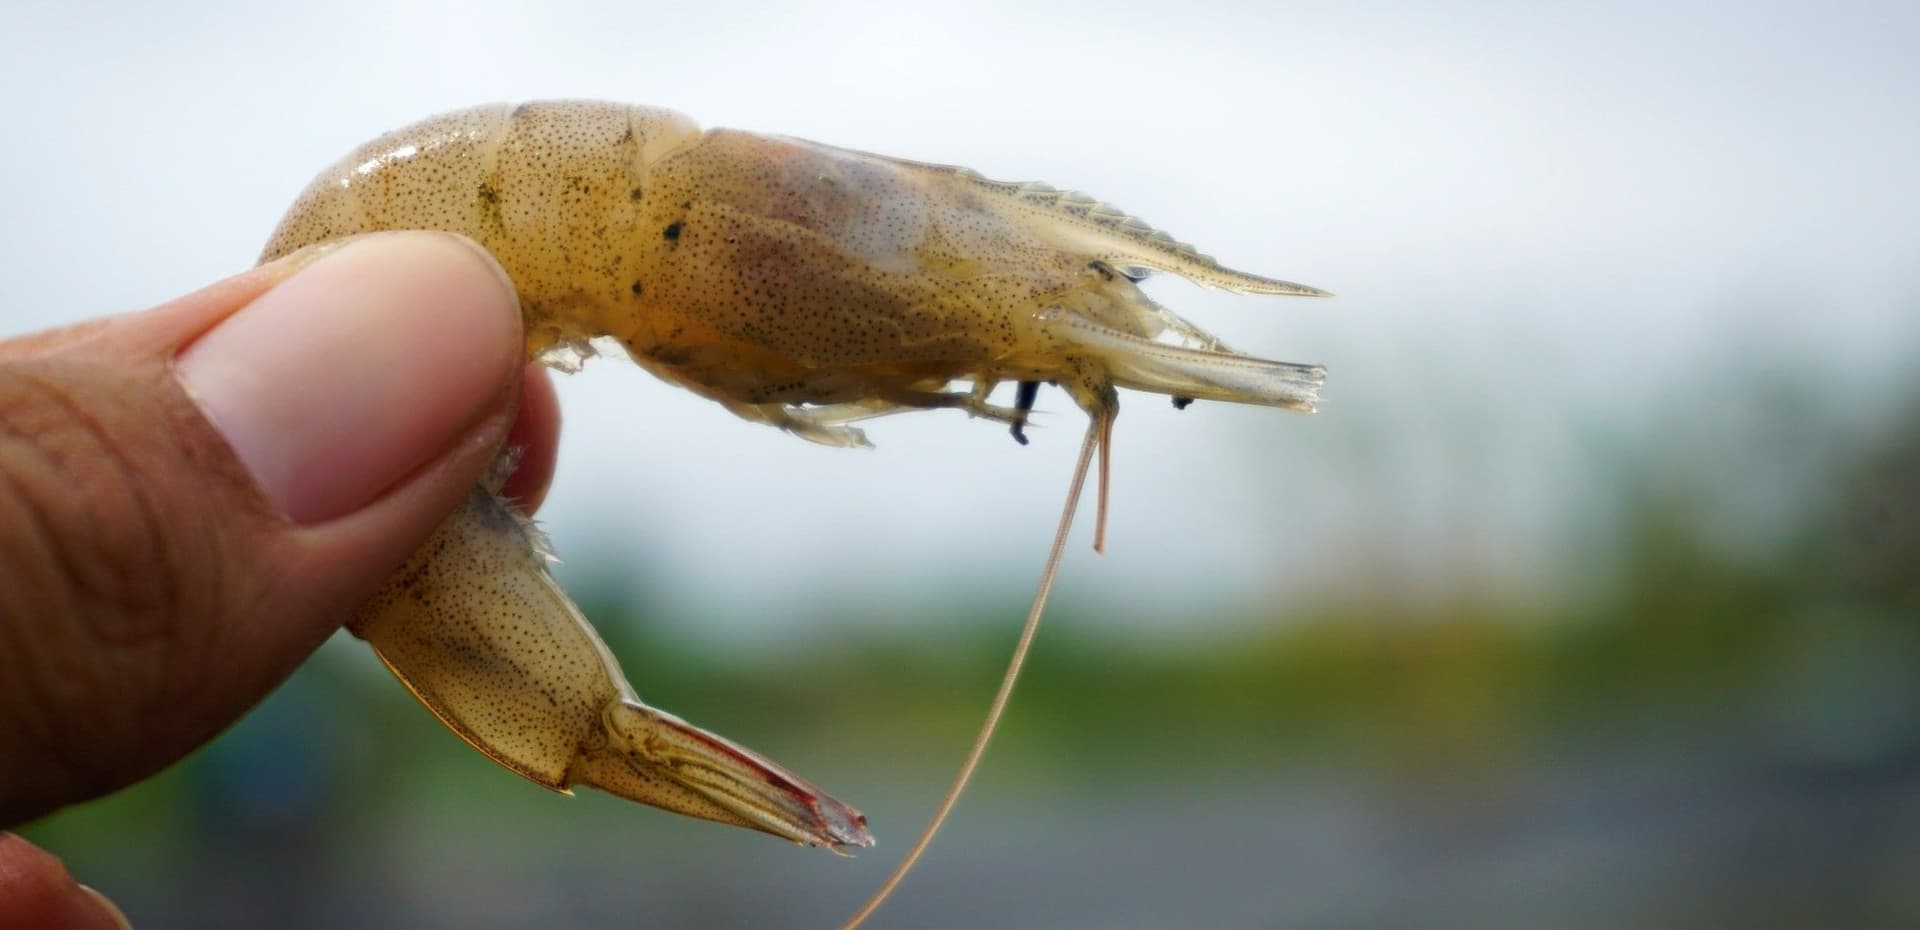
Vibrio bacteria are a group of bacteria that are commonly found in shrimp ponds. It has the potential to develop into a pathogenic bacteria that causes disease because of its opportunistic nature. Vibrio harveyi, Vibrio alginolyticus, and Vibrio parahaemolyticus are examples of these bacteria.
Based on the color expression of the colony, Vibrio is categorized into four types:
- Yellow Vibrio colonies, which is a type of Vibrio cholerae. This type of Vibrio can cause a decline in pH.
- Green Vibrio colonies, which come from Vibrio parahaemolyticus. This type of Vibrio can infect shrimp through wounds in the shrimp’s exoskeleton and spread through hemolymph.
- Black Vibrio colonies, which come from Vibrio damsela. This type of Vibrio has the ability to produce H₂S, a toxic gas for shrimp.
- Luminescent Vibrio colonies, which come from Vibrio harveyi. This type of Vibrio usually appears when the organic matter in the pond is high.
Vibrio in shrimp pond
Vibrio is always present in shrimp ponds as part of the ecosystem. Vibrio levels should be regularly monitored to ensure that they do not exceed 1x10⁶ CFU/ml to maintain the balance in the pond. A number of issues may occur if Vibrio has exceeded 1x10⁴ CFU/ml. Furthermore, farmers should take measures if total Vibrio dominates the total bacteria to prevent it from becoming pathogenic.
Vibrio lives at a salinity of 25-40 ppt with an optimal temperature range of 27-36℃ and grows abundantly under conditions of high accumulation of organic matter. Even in an environment with low oxygen levels, Vibrio can still grow by fermenting.
Vibrio and quorum sensing
Quorum sensing is a communication system or ‘language’ used by bacteria to communicate. Once this communication system develops, Vibrio can be pathogenic and harm the shrimp in the pond. When this communication occurs, that’s when the disease develops, and the more bacteria cells present, the stronger the signal for the communication is because bacteria are single-celled organisms.
Quorum sensing is like a plenary meeting in analogy. Once a “quorum” is attained, the meeting has produced an “outcome”. In the case of Vibrio, the “outcome” produced is Vibrio’s ability to become pathogenic.
Some of the consequences of quorum sensing is the occurrence of bioluminescence (the appearance of glow in the dark), toxic substances production, the development of biofilms, and so on. These occurrences may happen when Vibrio dominates the total bacteria in the pond. Thus, it is necessary to control quorum sensing to prevent the development of toxic substances.
Ways to analyze Vibrio dominance conditions
The analysis is conducted by comparing the trend of Vibrio bacterial density over time. Some farmers conduct weekly or biweekly checks by bringing samples to the laboratory. The dominance of Vibrio over total bacteria is then determined using the laboratory results, with a specific focus on each Vibrio colony’s density.
Farmers can analyze Vibrio dominance trends more easily using JALA App. Most importantly, the laboratory results obtained are then recorded in the microbiology record. You can record it by selecting the recording menu in the Homepage, select “Water Quality”, and select “Set input parameters” to add microbiology input, then input the results from the laboratory for each colony type found.
Recording can also be done through the “Excel Input” menu, and customize the Excel display for microbiology input by selecting “Laboratory” tab and sub menu “Microbiology test” tab. To access the Excel Input menu, you have to upgrade your account to PRO Cycle, which allows for quicker recording by simply “copying” and “pasting” from the Excel file of laboratory results.
The next step is analyzing the conditions based on the recorded data. JALA App has several features that support this analysis, namely:
1. The histogram of Vibrio composition
The histogram of Vibrio composition can be accessed in two ways, namely on the dashboard of the pond homepage and the Excel Input menu, specifically in the “Laboratory” tab, sub menu “Microbiology test” tab.
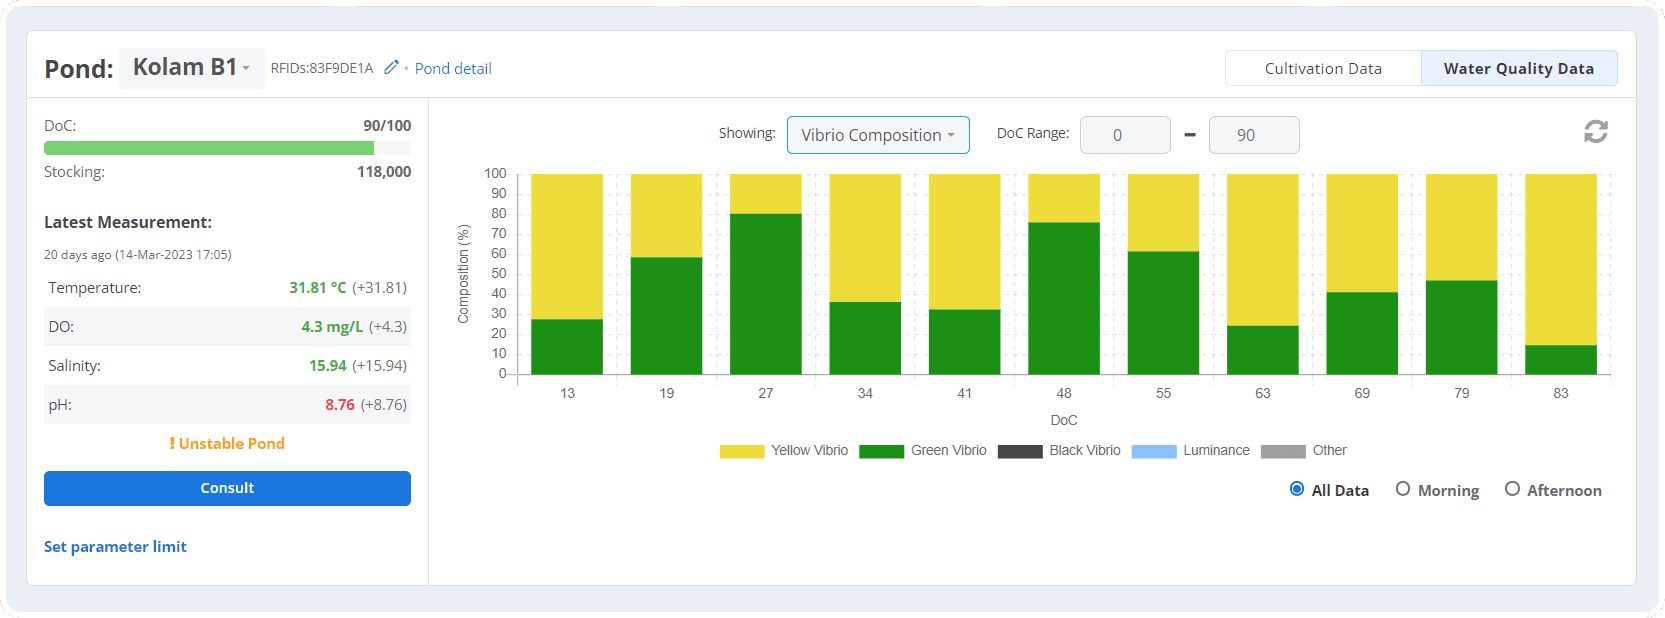 The histogram of Vibrio composition display as seen from the dashboard
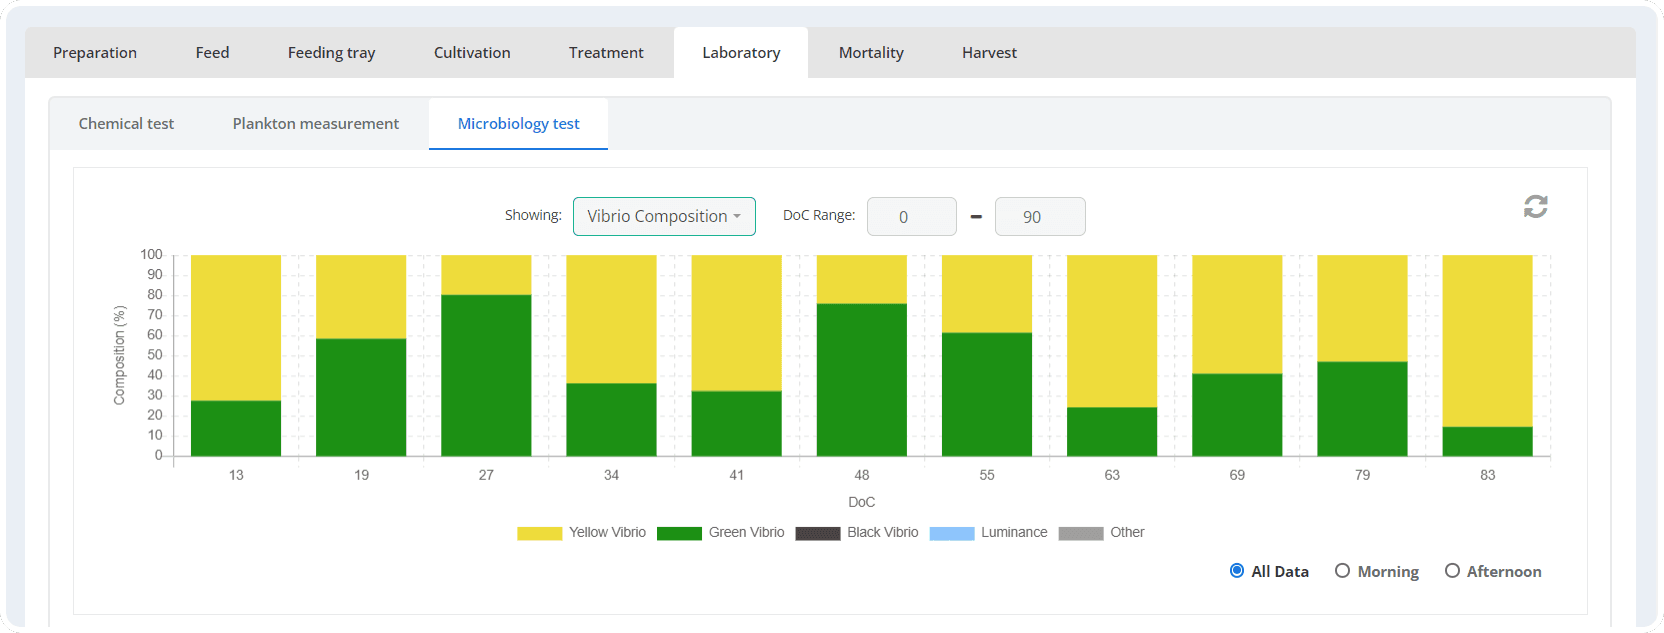 The histogram of Vibrio composition display as seen from the Excel Input menu
This composition histogram will provide an overview of the trend for the dominant Vibrio colony type. Each color represents the Vibrio colony type. As previously mentioned, each colony has its own consequences if it exceeds the normal limit. Therefore, the analysis is focused on the total population that does not exceed the limit.
2. Vibrio ratio chart
The second focus of analysis is the Vibrio domination ratio toward total bacteria. If the total Vibrio exceeds a certain limit, quorum sensing can occur. Some experts mention that the maximum limit is 10% of the total bacteria, and some also mention that the limit is 5%. You can modify it in settings. Once the ratio exceeds the limit, it will be in the red area as portrayed in the figure below.
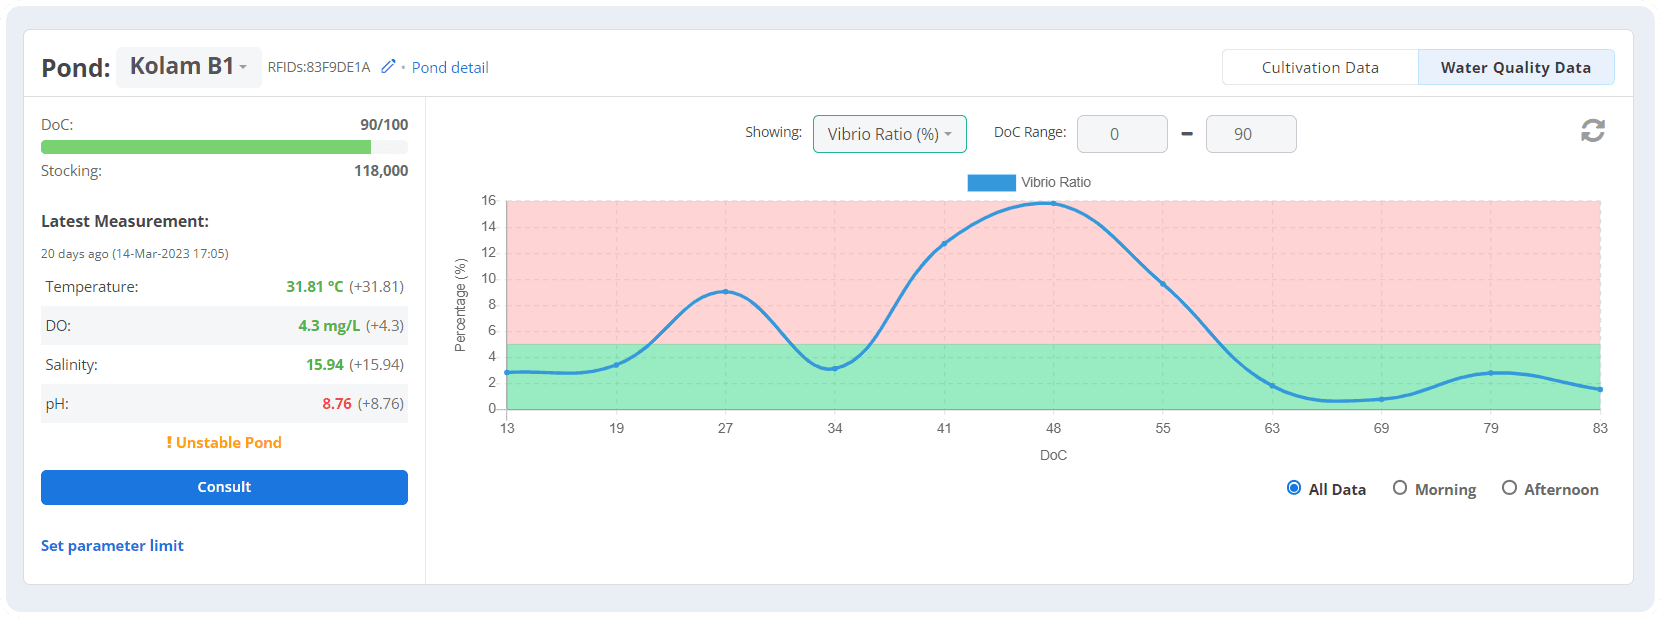 The display of Vibrio ratio chart as seen from the dashboard
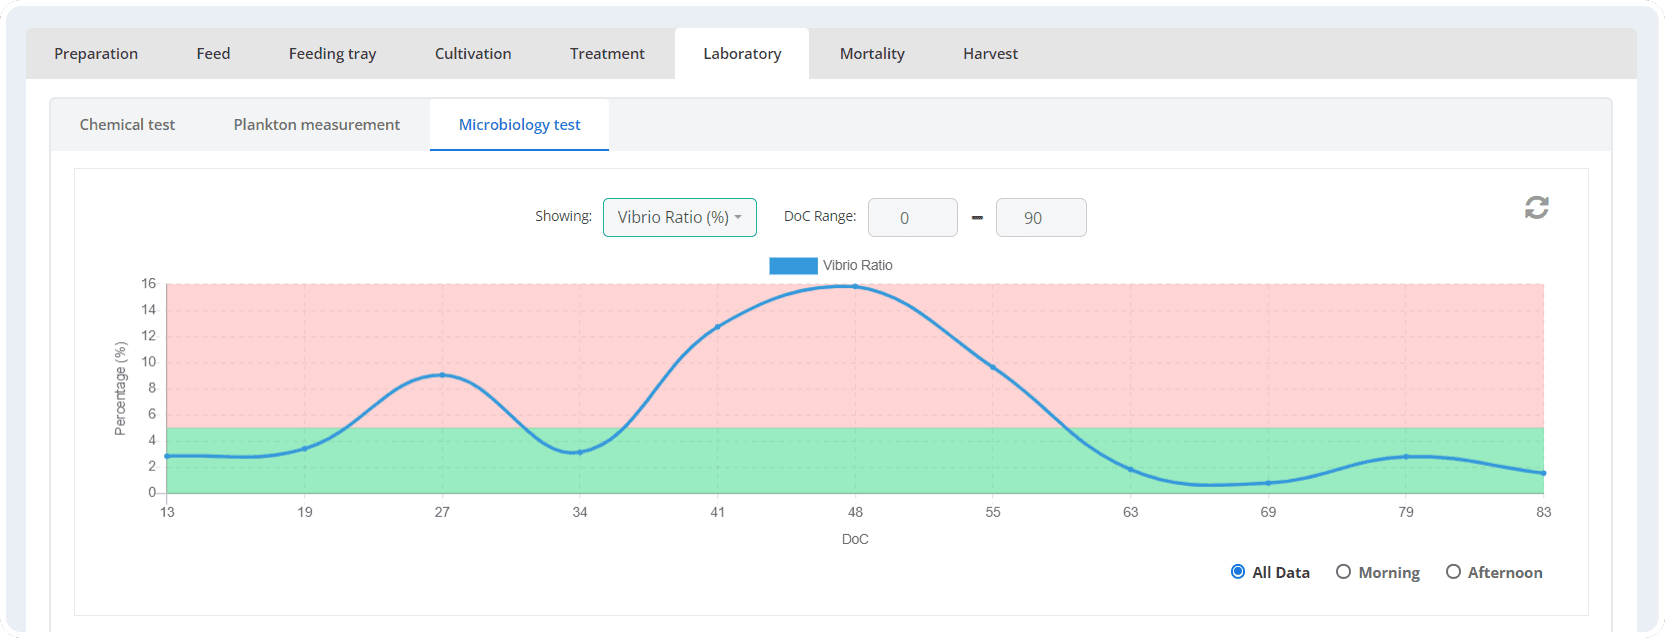 The display of Vibrio ratio chart as seen from Excel Input menu
This Vibrio ratio chart can be accessed in two ways as well, namely from the dashboard of the pond homepage and through Excel Input menu, specifically in the “Laboratory” tab, sub menu “Microbiology test” tab.
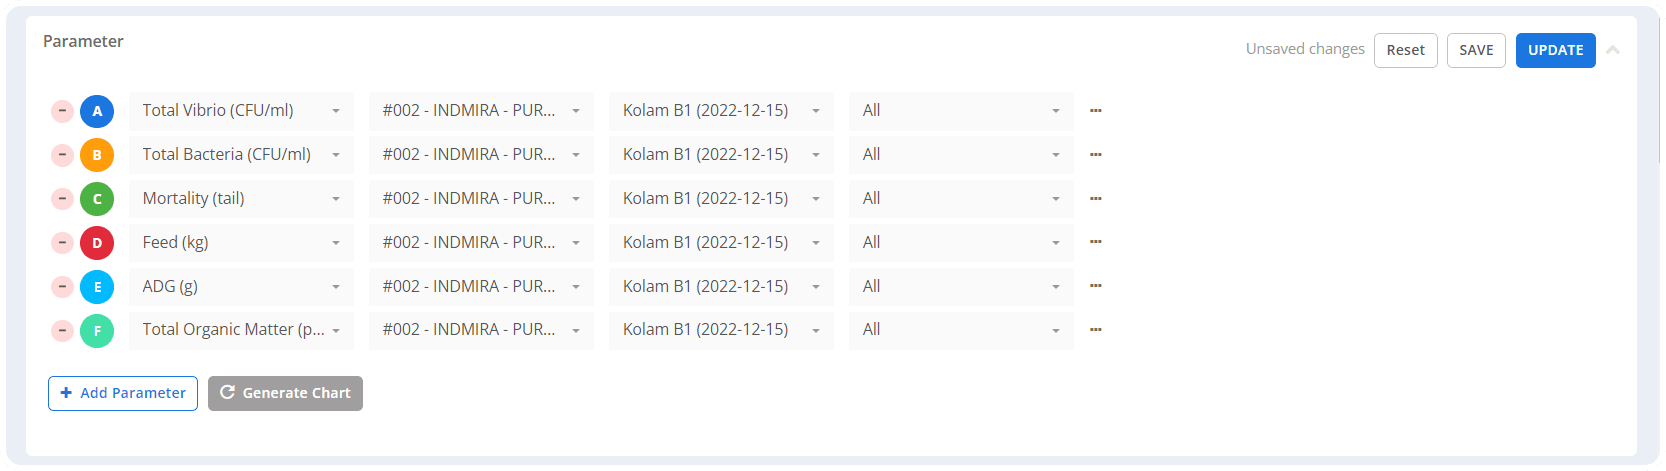
3. Using Analysis Chart feature
A more in-depth analysis can be conducted by comparing the total colony of each Vibrio or total Vibrio toward various parameters. You can link it to other water quality parameters or to productivity parameters.
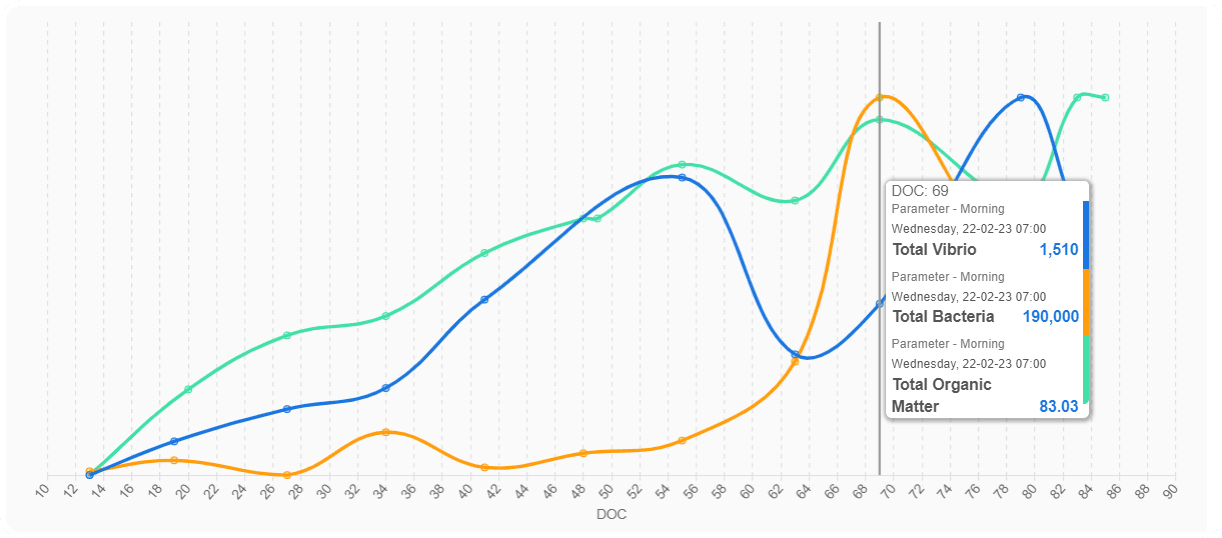
 For example, comparing total Vibrio and total bacteria to the amount of organic matter. It is mentioned in the previous explanation that bacteria will develop as more organic matter is present. The chart below displays that the total bacteria (orange line) spikes at DoC 69, but the total Vibrio (blue line) remains fortunately low.
Supported by the increase of organic matter (light green line), the total growth of bacteria reaches 10⁵ CFU/ml, indicating that it nearly reaches the maximum limit. According to this result, farmers can take measures to address the condition before it has an impact on productivity.
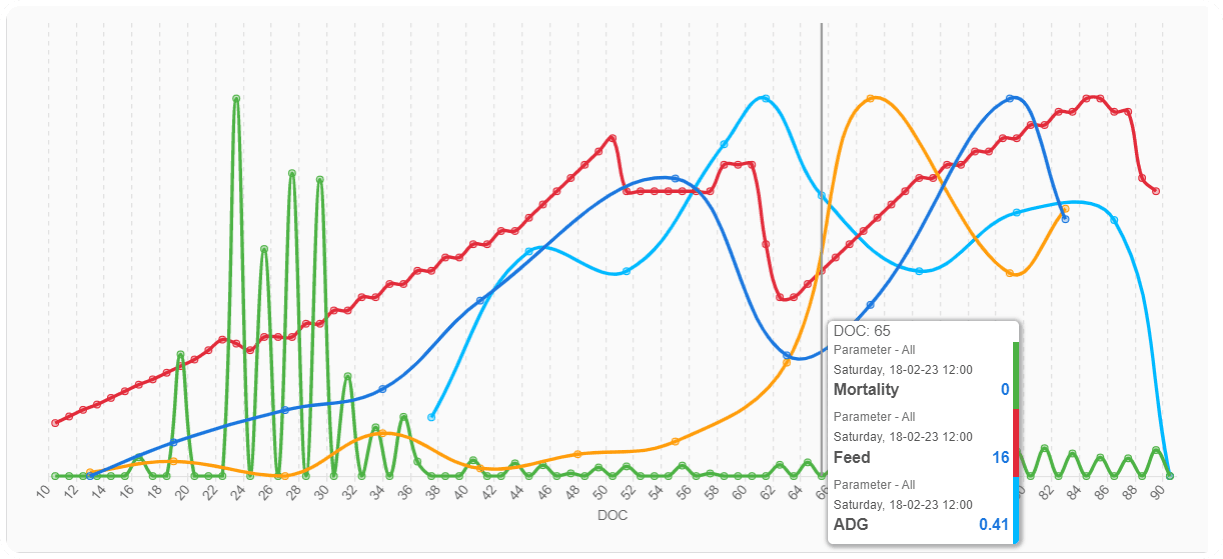
 To see the potential impact on productivity, include the mortality (dark green line), feeding (red line), and shrimp growth rate or ADG (light blue line) parameters.
ADG exhibits a declining trend when it enters the DoC 60s, while feeding continues to rise. There is an indication of wasted feed assuming it is not consumed properly (the rate of ADG is declining) and addressed directly by the trend of increasing amounts of organic matter in the previous figure. Fortunately, no mortalities are recorded.
 Since the shrimp growth response is slowing down, the FCR has the opportunity to spike. A variety of analysis results will appear according to the data, field conditions, and farmer experiences. This data and feature will support the analysis process in determining the conditions being encountered and the possibility of right decisions to take certain measures or treatment.
Ways to lessen Vibrio domination
After conducting an in-depth analysis, it is better to take several measures to lessen Vibrio domination in the pond. Several measures that can be taken are as follows:
First, maintain control of total organic matter (TOM) through periodical checking. If organic matter accumulation occurs, do siphon regularly. This measure will reduce the growth of bacteria media.
Second, apply treatment, such as the addition of Vibrio competitor probiotics. Use the right dose according to the reduction target, for example, you will need several liters of probiotic activation and control its effectiveness to reduce the total Vibrio from 10⁶ CFU/ml to 10⁴ CFU/ml.
Monitoring and taking measures to mitigate Vibrio dominance are essential to protect shrimp from Vibrio-caused diseases. JALA App is ready to assist your shrimp farm management needs. Always use JALA App, an easy and convenient cultivation recording and monitoring app.
Register for JALA App now at app.jala.tech or download the app from Google Play Store or App Store. It’s free! Don’t forget to upgrade your account to PRO Cycle to access the Excel Input and Analysis Chart features.